8.4 t-test
What if the sample size \(n\) is small?
Suppose \(X_1, X_2, \cdots, X_n\) are i.i.d. normal, with unknown mean \(\theta\) and unknown variance \(\sigma^2\).
\[ \small{T_n=\frac{\bar{X}-\mu}{\hat{S}_n/\sqrt{n}}} \]
has a t-distribution with \(n-1\) degrees of freedom.
t-test about a population mean:
Just like the z-test, except when calculating the p-value, we use the t-table instead of the z-table.
Smoking impairs time estimation accuracy?
- 20 smokers estimated how much time had elapsed during a 45-sec period with the following perceived elapsed time (s)
\[ \small{ \begin{aligned} 59, 55, 62, 63, 49, 45, 29, 42, 57, 47 \\ 46, 40, 60, 37, 46, 35, 60, 54, 57, 43 \\ \end{aligned} } \]
- Does the perceived elapsed time for smokers significantly differ from the known time 45-sec?
- Let’s carry out a hypotheses testing at significance level \(\alpha=0.01\).
\(\mu\): mean perceived elapsed time for all smokers
\[ \small{H_0: \mu=45, \;\;\;\;H_a: \mu \neq 45} \]
We assume the perceived time is normally distributed.
\[ \small{ \begin{aligned} \text{Sample size }n&=20 \\ \text{Sample mean }\bar{x}&=49.3 \\ \text{Sample standard deviation }s&=\sqrt{\frac{\sum(x_i-\bar{x})^2}{n-1}}\approx9.84 \\ \text{Sample standard error }\frac{s}{\sqrt{n}}&=\frac{9.84}{\sqrt{20}}\approx2.200 \\ \end{aligned} } \]
The sample size of 20 is not large enough to apply CLT.
For small sample size we will use t-test (\(v=19\)).
\[ \small{H_0: \mu=45, \;\;\;\;H_a: \mu \neq 45} \]
\[ \small{\bar{x}=49.3, \;\;\;\;\frac{s}{\sqrt{n}}=2.200} \]
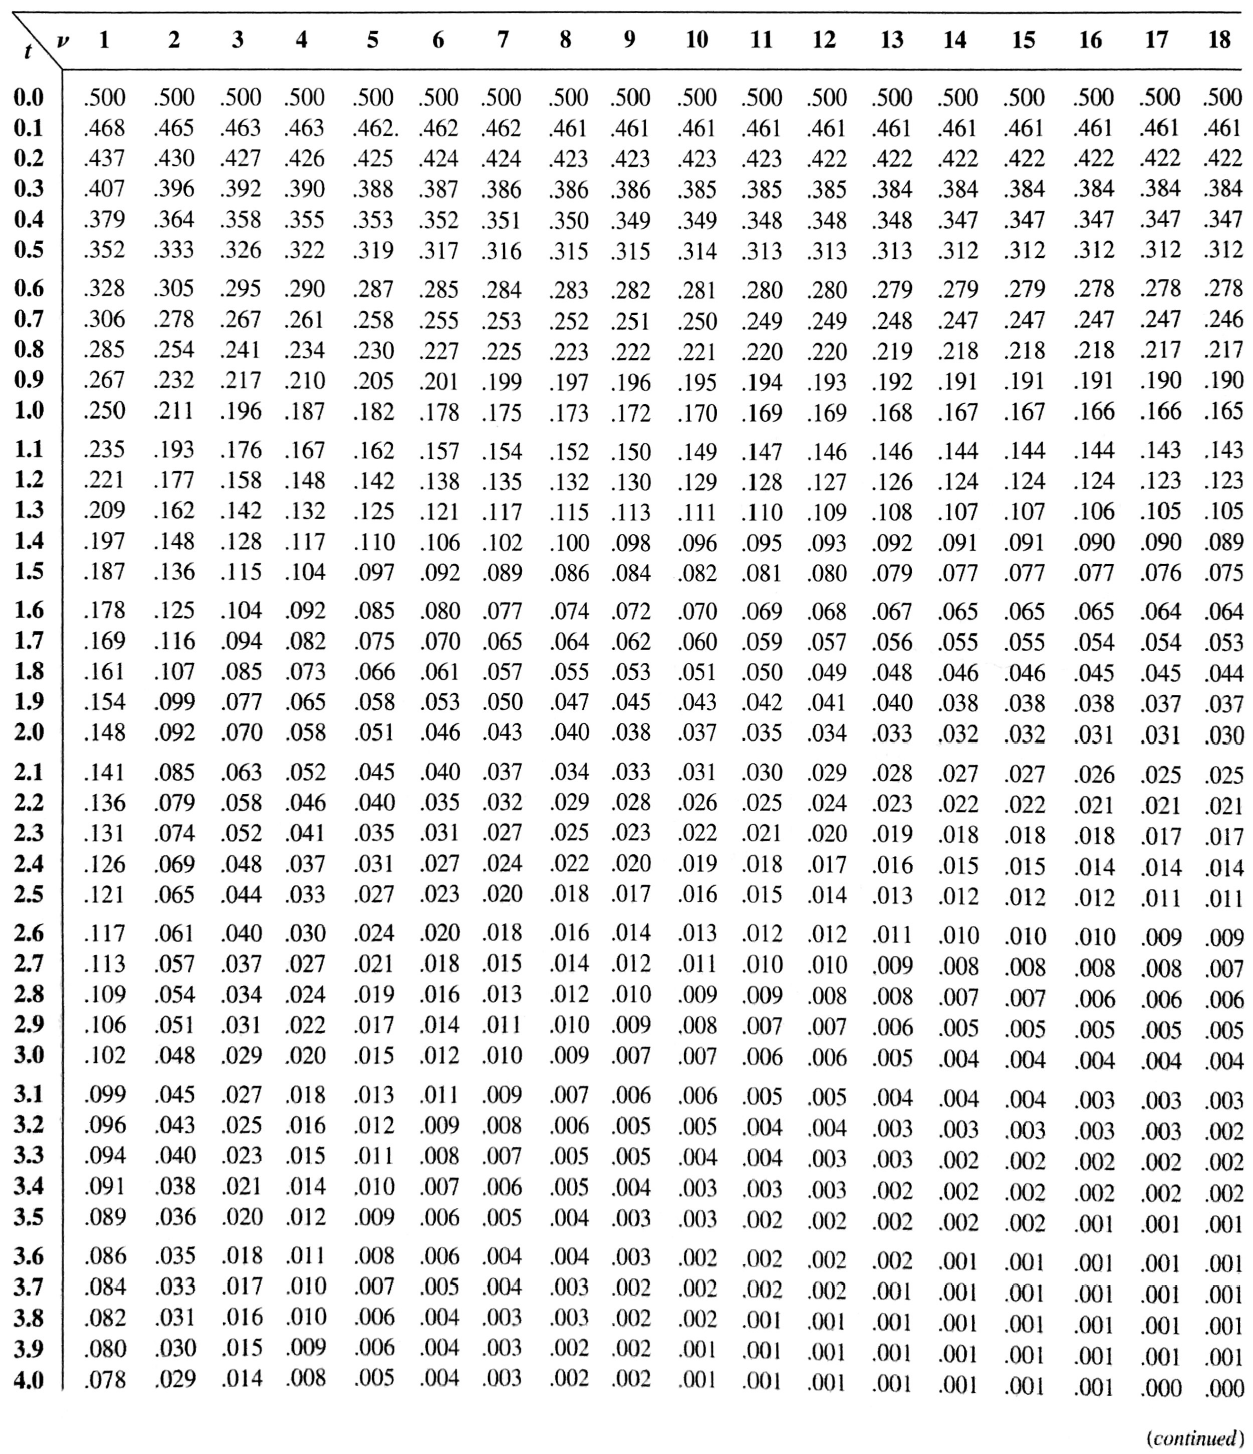
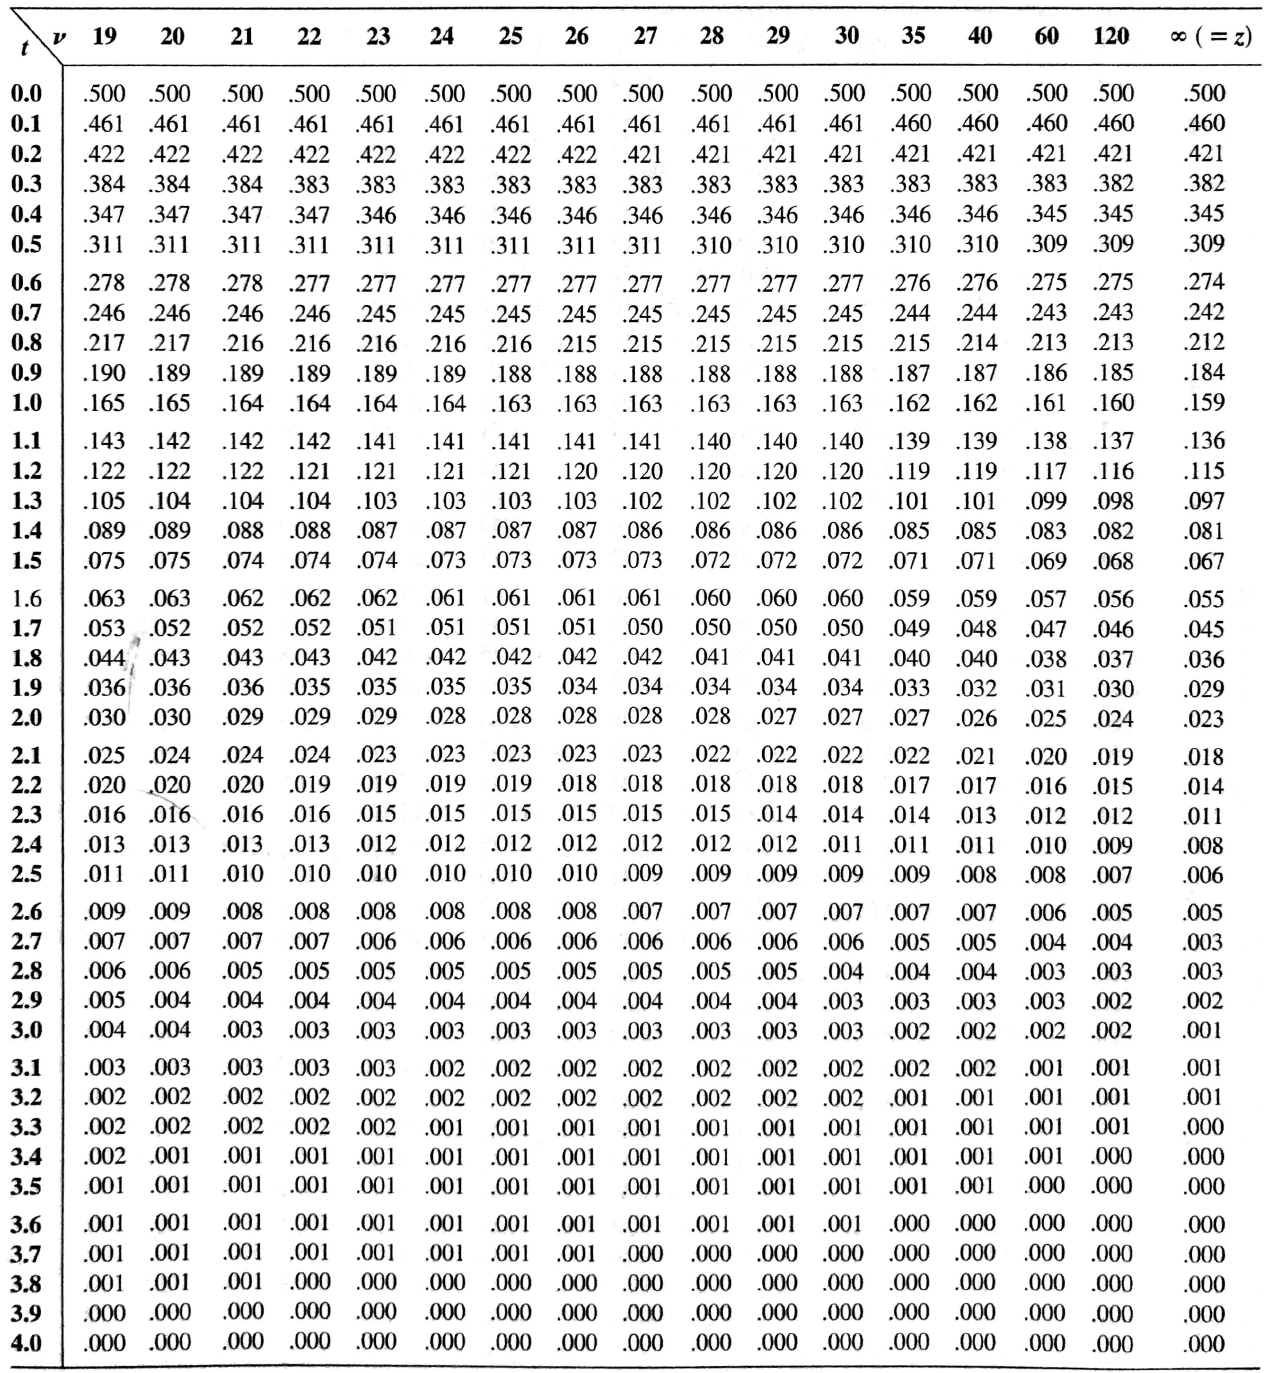
\[ \begin{aligned} p\text{-value}&=2\cdot\text{P}(\bar{X}\geq 49.3 \text{ when $H_0$ is true}) \\ \\ &=2\cdot \text{P}(\bar{X}\geq 49.3 \text{ when $\mu=45$}) \\ \\ &=2\cdot \text{P}\bigg(\frac{\bar{X}-45}{2.200} \geq \frac{49.3-45}{2.200}\bigg) \\ \\ &=2\cdot \text{P}(T \geq 1.95) \\ \\ &\approx 2\cdot 0.035 = 0.07 \\ \end{aligned} \]
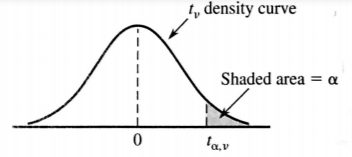
t-curve
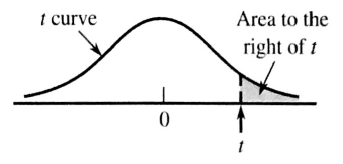
t-table in the next two slides
Smoking impairs time estimation accuracy?
\[ \small{H_0: \mu=45, \;\;\;\;H_a: \mu \neq 45} \]
\[ \small{p\text{-value} = 0.07} \]
\[ \small{\text{At $\alpha=0.05$ we failed to reject $H_0$ as $p$-value $> \alpha$.}} \]
Conclusion:
The data does not provide evidence that the true mean perceived elapsed time for all smokers differs significantly from the known time 45-sec.
Similarly, we can also use the test statistic.
\[ \small{\text{Test statistic: }\;\;t=\frac{\bar{x}-\mu}{s/\sqrt{n}}}=\frac{49.3−45}{2.200}=1.95 \]
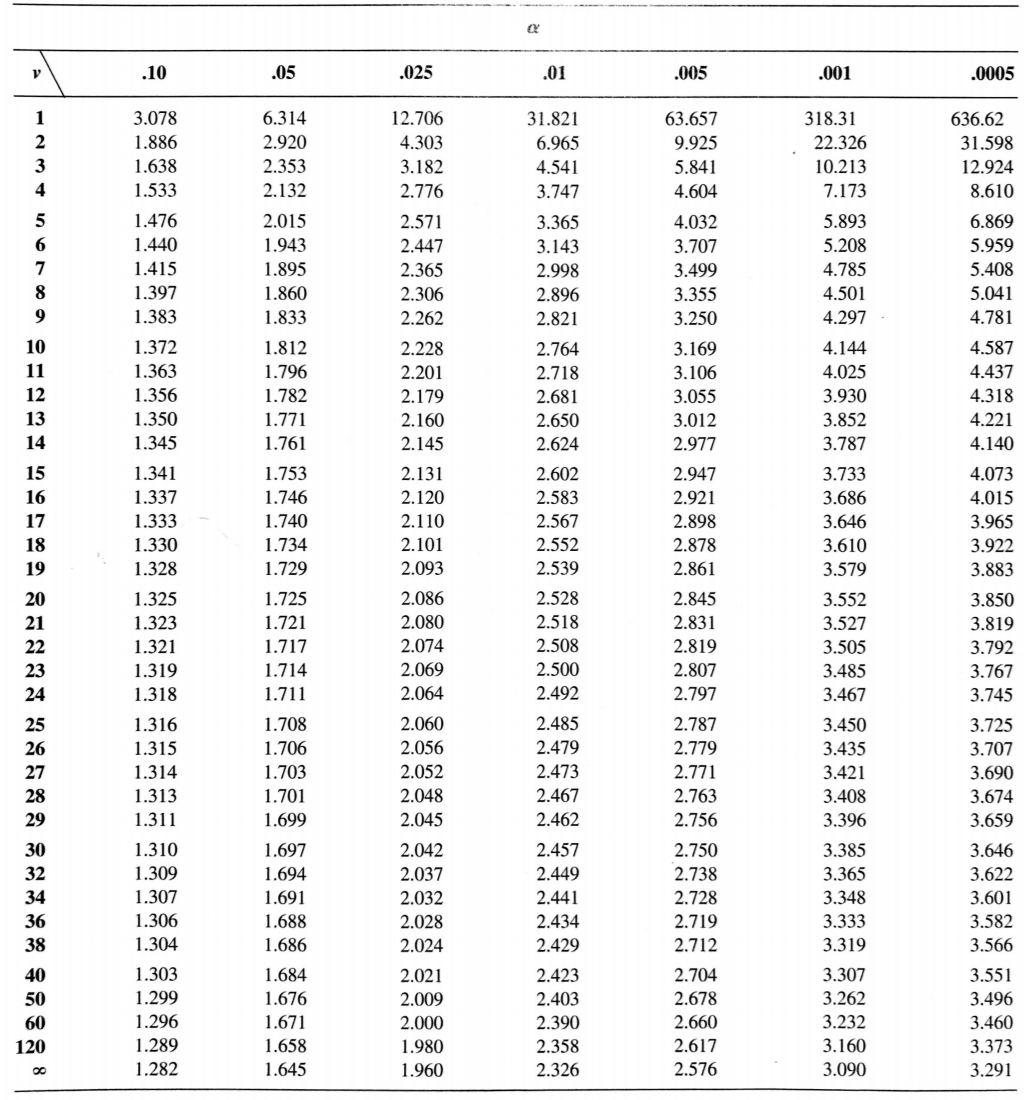
\[ \small{\text{At $\alpha=0.01$ the critical value}} \]
\[ \small{t_{\frac{\alpha}{2}, n-1}=t_{0.005, 19}=2.861} \]
\[ \small{\text{Since $|t| < t_{\text{critical}}$, we failed to reject $H_0$.}} \]
Critical values for t distribution